
Szczepanik Research Group
Department of Theoretical Chemistry
Faculty of Chemistry, Jagiellonian University
Gronostajowa 2, 30-387 Krakow, Poland
Tel: (+48) 12 686 23 90
E-mail: dariusz.szczepanik@uj.edu.pl
HOME PROJECTS PUBLICATIONS runEDDB X
About EDDB Download Tutorials Manual
◼ Tutorial 5 — Substituent effects from differential BDF maps
A hydrogen-bonded dimer of acrylic acid, and the same dimer with an amino or a cyano group on the β-carbon. Which substituent really changes the π-delocalization, and where? Comparing two BDF maps by eye rarely answers that; subtracting them point by point does. The differential map ΔBDFπ = BDFπ(perturbed) − BDFπ(reference) shows in one picture where delocalization grows and where it shrinks.
Before you start
We study the hydrogen-bonded dimer of (E)-acrylic acid and two derivatives substituted at the β-carbon: R = NH2, a π-electron donor, and R = CN, a π-electron acceptor. The parent dimer, R = H, is the reference against which both are compared. You need three geometry files, each holding a separately optimized dimer:
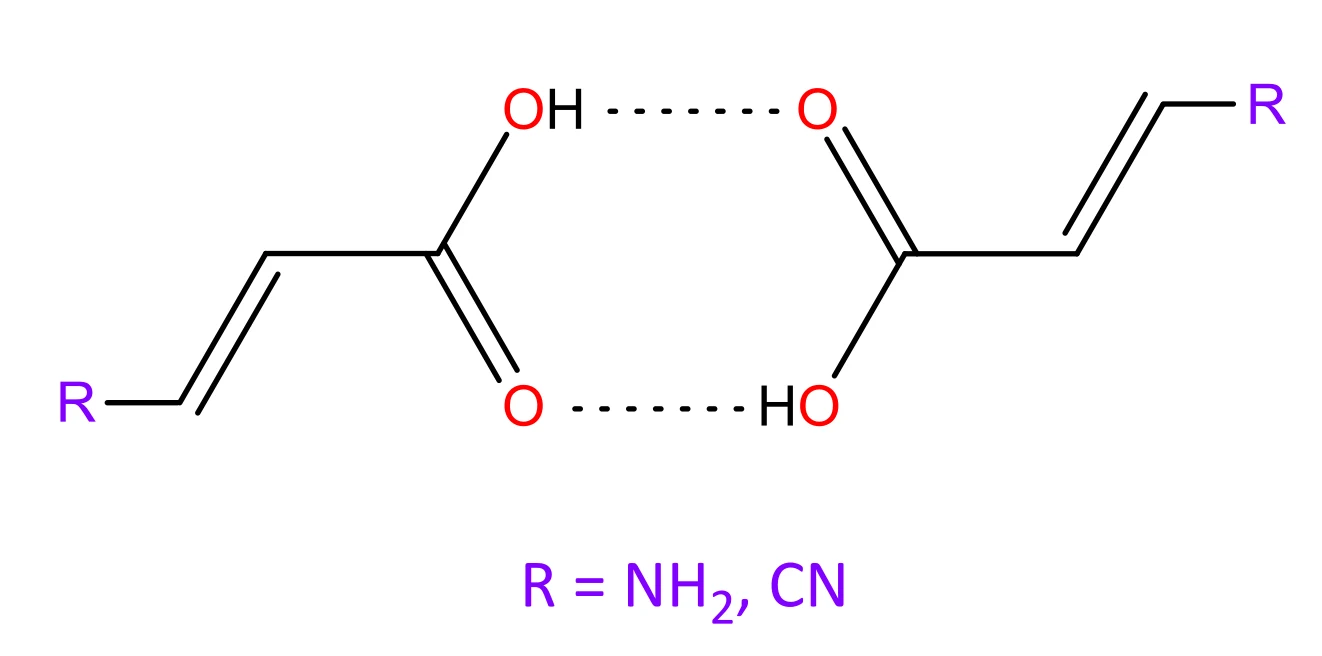
Figure 1. The carboxylic-acid dimers studied: R = H (reference), NH2 and CN. The molecules are held together by a pair of O–H···O=C hydrogen bonds.
All runs below use the built-in GFN2-xTB engine (the input is a plain .xyz file) and finish in about a second.
Part 1 — Choosing the π-NOBDs
The parent monomer has six π-electrons: two from the C=C bond, two from the C=O bond and a lone pair on the hydroxyl oxygen. The amino substituent adds its nitrogen lone pair, and the nitrile adds the component of its triple bond that lies perpendicular to the molecular plane — two electrons in both cases. The dimers therefore have 12 (R = H) or 16 (R = NH2, CN) π-electrons, so the R = H dimer has six π-type NOBDs and the substituted dimers eight.
If a π-NOBD is missing in either the substituted or the reference system, the difference map shows an artefact wherever it is missing. The order of the NOBDs can also differ between the two systems, so the right ones have to be identified in each. Print the NOBD table and export the orbitals for viewing, for each of the three dimers:
Open H.NOBD_G.fchk in Avogadro2 (as in Tutorial 2) and look at the orbitals together with the %p column:
- R = H. The π-NOBDs are 1–4 and 11–12 (100 % p). The σ-type NOBDs 5–10 sit between them in occupancy, so “the six largest” would be the wrong six. The low occupancy of the C=C π-NOBDs (11, 12) reflects their localized character, while the relatively high occupancy of the σ orbitals 5–10 comes from the strong hydrogen bonds.
- R = NH2. The eight π-NOBDs are also the eight largest (1–8), so no σ-type NOBD interleaves them.
- R = CN. Inspect the NOBDs yourself. NOBDs 13 and 14 are 100 % p, yet they are left out: they carry the in-plane component of the C≡N triple bond, which lies in the molecular plane and is orthogonal to the conjugated π-system.
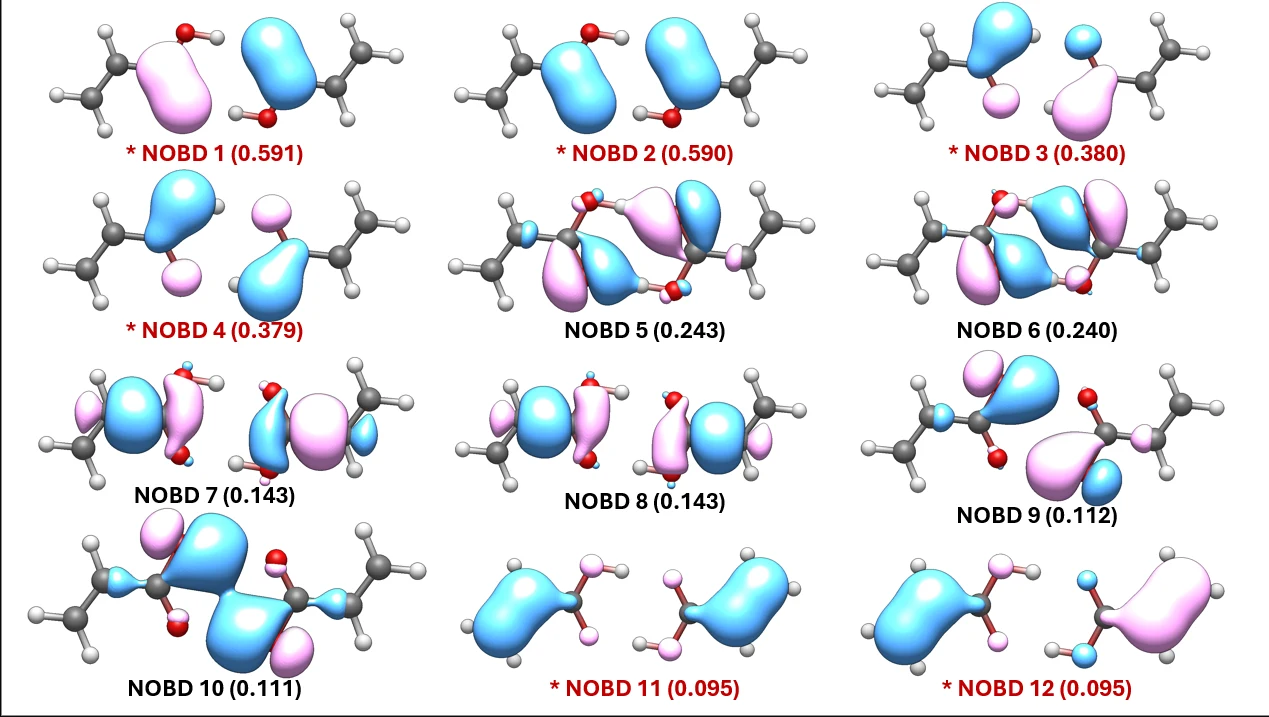
Figure 2. NOBDs 1–12 of the R = H dimer, with occupancies. The six π-NOBDs are marked in red with an asterisk.
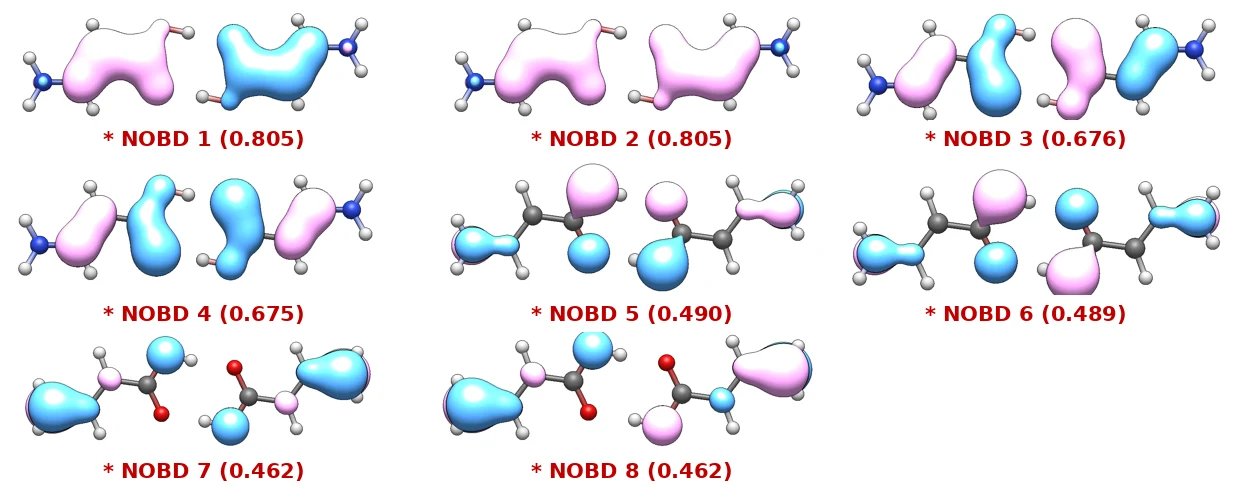
Figure 3. The eight π-NOBDs of the R = NH2 dimer, with occupancies.
Whatever the selection, the summary block of the dissected run provides the check: Total ED_G must equal the formal π-electron count.
Table 1. The π-NOBD selections, and the check that validates them.
| dimer | π electrons | π-NOBDs | -s list | Total ED_G (check) |
|---|---|---|---|---|
| R = H | 12 | 6 | 1:4,11,12 | 12.000 |
| R = NH2 | 16 | 8 | 1:8 | 16.000 |
| R = CN | 16 | 8 | 1:4,7,8,11,12 | 16.000 |
Part 2 — The reference BDF map (R = H)
- -s 1:4,11,12 — dissect the six π-NOBDs chosen in Part 1.
- --export-cube bdf — write BDFπ to H.BDF_G.cube. This cube is the reference for both differential maps below; it fixes their grid as well as their baseline values.
- --table npa — print the natural population analysis.
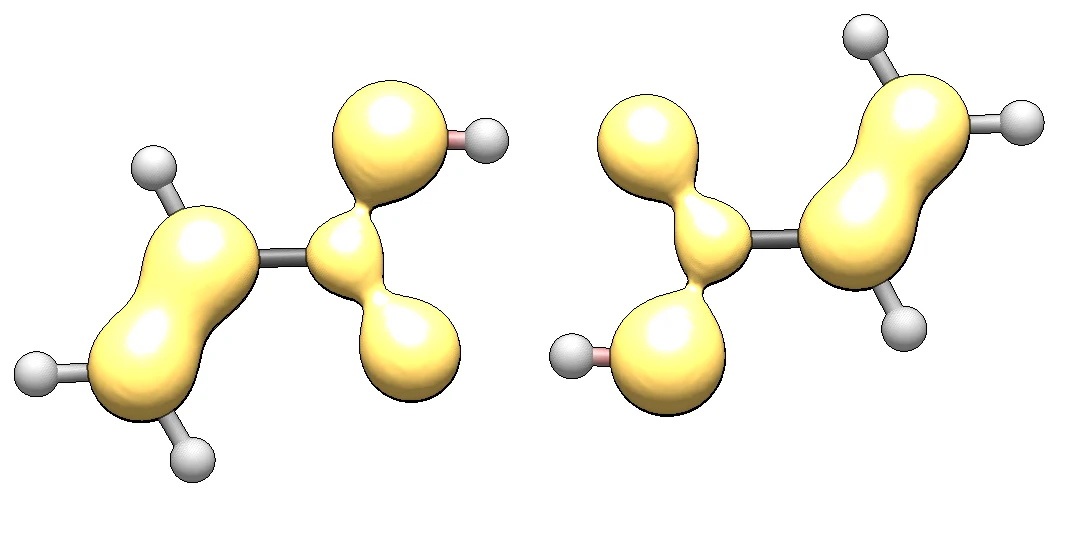
Figure 4. BDFπ of the unsubstituted dimer, isosurface 0.025. Yellow: BDFπ < 0 (localized bonding dominates).
Only negative lobes appear at this isovalue. The π-system of acrylic acid is dominated by localized bonding: the vinyl C=C bond, the carboxyl C=O bond and the oxygen lone pairs each appear as a separate localized domain, and only 17.7 % of the π-density is delocalized (Total EDDB_G 2.129 of 12.000 e).
What delocalization there is stays almost entirely in the carboxyl fragment: the per-atom EDDB_G values in the NPA table place about 91 % of it on the three carboxyl atoms (C2, O3, O4), and the four π-NOBDs with the highest occupancies (1–4, Figure 2) are carboxyl orbitals, while the vinyl C=C bond carries only NOBDs 11 and 12.
Part 3 — The differential map for R = NH2
We now compute BDFπ(NH2) on the grid of the reference from Part 2 and subtract:
ΔBDFπ = BDFπ(NH2) − BDFπ(H)
Positive values of ΔBDFπ mark regions where delocalization increases upon NH2 substitution; negative values, a decrease (localization).
- -s 1:8 — the eight π-NOBDs of the R = NH2 dimer.
- --export-cube dbdf — write the differential map, NH2.DBDF_G.cube.
- --cube-ref H.BDF_G.cube — the reference. Its grid is cloned exactly and its values are subtracted, so no -c is needed.
- --cube-align 1:4,6,10:13,15 — superimpose the NH2 geometry onto the reference stored in H.BDF_G.cube. The rigid rotation and translation (Kabsch algorithm) minimize the distances between the listed atoms — here all heavy atoms of the acrylic-acid dimer core to which R is attached.
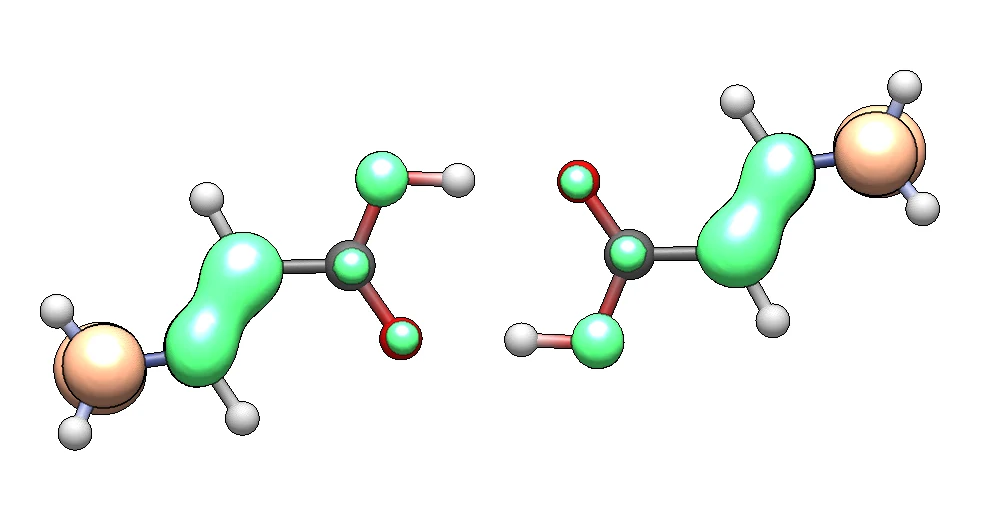
Figure 5. ΔBDFπ(NH2 − H), isosurface ±0.020. Green: ΔBDFπ > 0; orange: ΔBDFπ < 0.
- Delocalization in the C=C bond region increases markedly: the amino lone pair enters into resonance with this double bond.
- Delocalization in the carboxyl group increases too, to a lesser extent.
- The orange region at the nitrogen comes only from the BDFπ map of R = NH2. The reference has no nitrogen and no π-density there, so the map shows the amino group’s own, largely localized lone pair rather than a change.
Because both runs printed --table npa, we can also follow how the π-electrons redistribute. Figure 6 shows the change of the per-atom ED_G populations read from H.log and NH2.log, ΔED_G = ED_G(NH2) − ED_G(H).
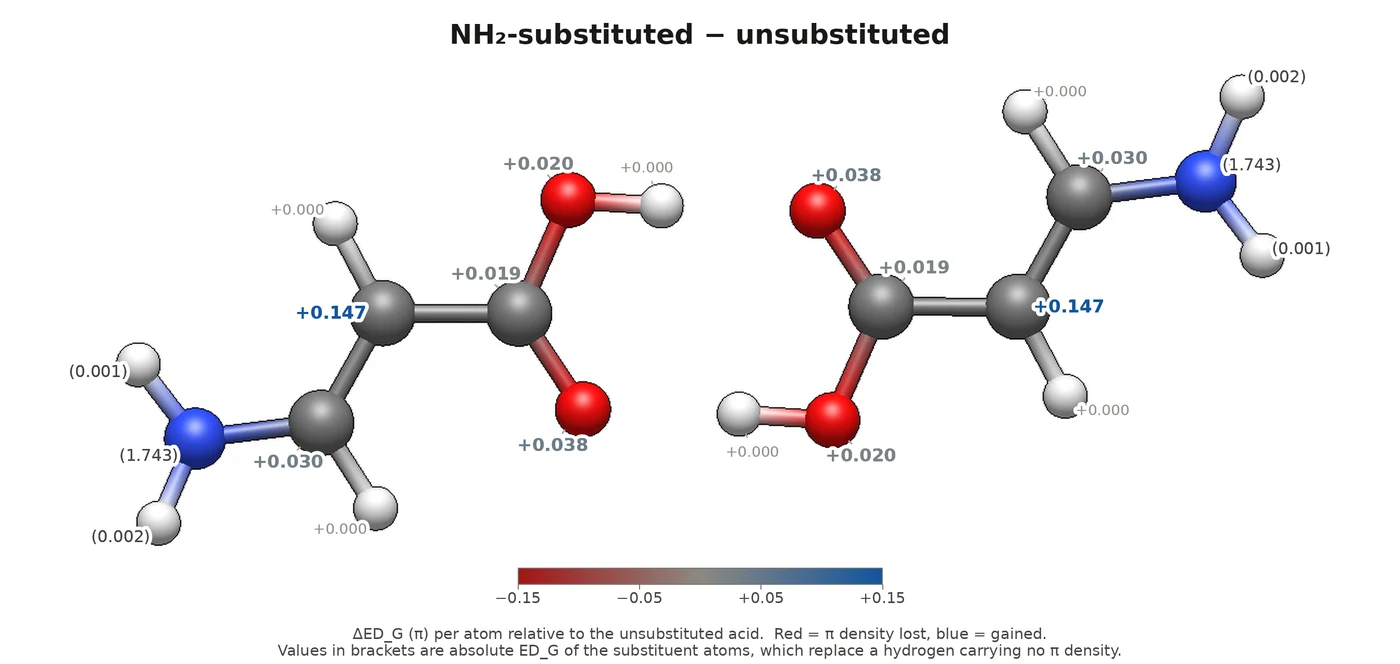
Figure 6. ΔED_G(NH2 − H). Red: π-density lost; blue: gained. Values in brackets are the absolute populations of the substituent atoms.
The π-density of the amino lone pair spreads over the whole π-system. The largest gain is on the α-carbon (+0.147 e), and the carbonyl oxygen also gains noticeably (+0.038 e). Both the change in delocalization and this π-polarization follow from resonance structures (1) and (2) contributing alongside the base structure (0). Structure (2) in particular favours the hydrogen bond: it places a negative charge on the acceptor oxygen. The strengthening shows up as a shorter hydrogen bond — H···O is 1.675 Å for R = H and 1.668 Å for NH2.
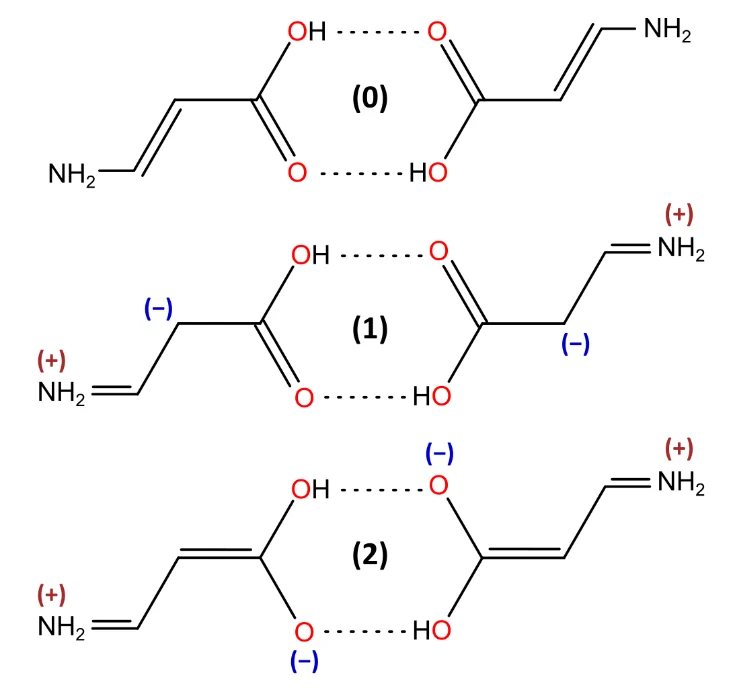
Figure 7. Resonance structures of the amino-substituted dimer.
Part 4 — A contrasting case: the electron-withdrawing group (R = CN)
-s 1:4,7,8,11,12 selects the eight π-NOBDs and leaves out the in-plane nitrile NOBDs 13 and 14. The alignment RMSD is 0.015 Å.
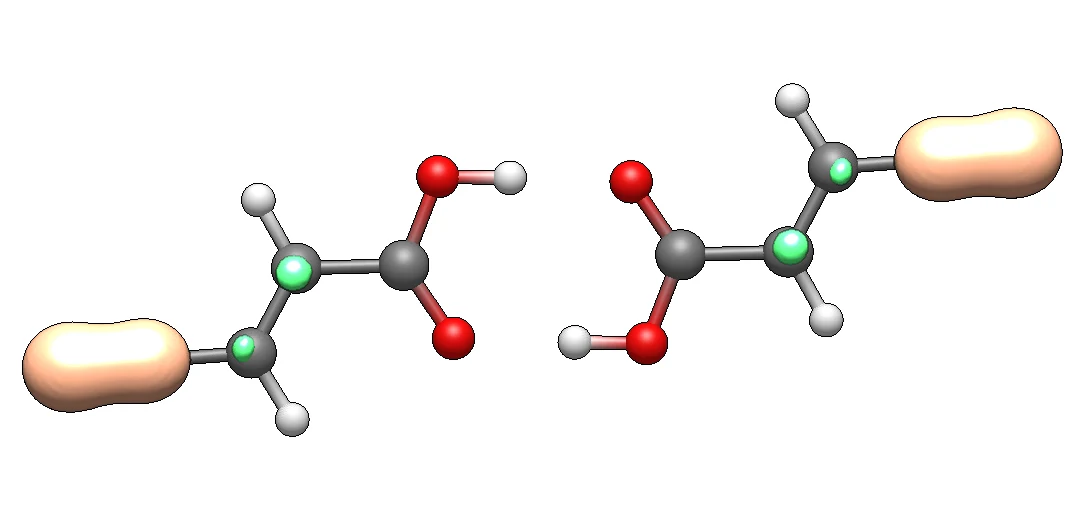
Figure 8. ΔBDFπ(CN − H). Colours as in Figure 5.
In contrast to NH2, the CN group changes the delocalization of the acrylic-acid dimer only slightly. Small green isosurfaces appear on the two vinyl carbons, and the carboxyl group shows no change at this isovalue. The large orange lobe on the nitrile is, like the one on the amine nitrogen, the substituent’s own localized π-bond rather than a reorganization. The electron-withdrawing group perturbs the C=C bond slightly, and the perturbation stops there.
The π-populations, ΔED_G = ED_G(CN) − ED_G(H), tell the same local story. The largest change is a small loss on the α-carbon (−0.032 e), partly offset by a gain on the β-carbon (+0.021 e); everything else moves by less than 0.01 e.
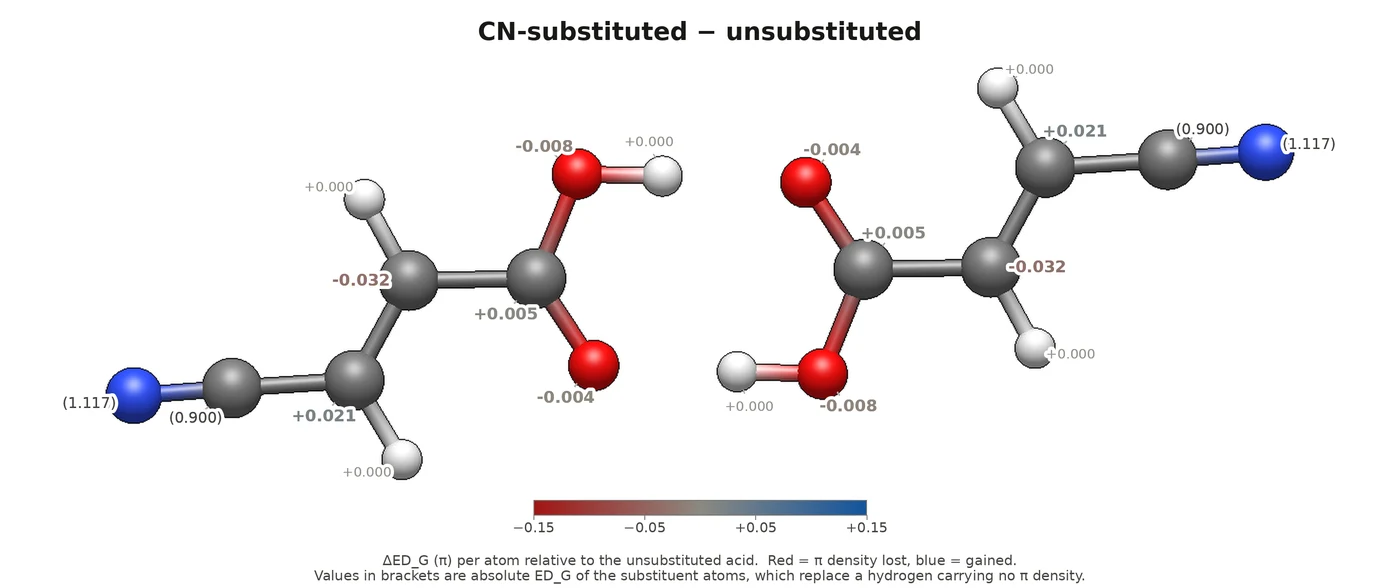
Figure 9. ΔED_G(CN − H), on the same colour scale as Figure 6.
This slight polarization corresponds to resonance structure (1) in Figure 10, with a positive charge on the α-carbon. Its weight is much smaller than that of the corresponding structure for NH2: the change of the π-population on the α-carbon is almost five times smaller. And unlike the amino group, the nitrile does not reinforce the hydrogen bond: H···O lengthens slightly, to 1.679 Å.
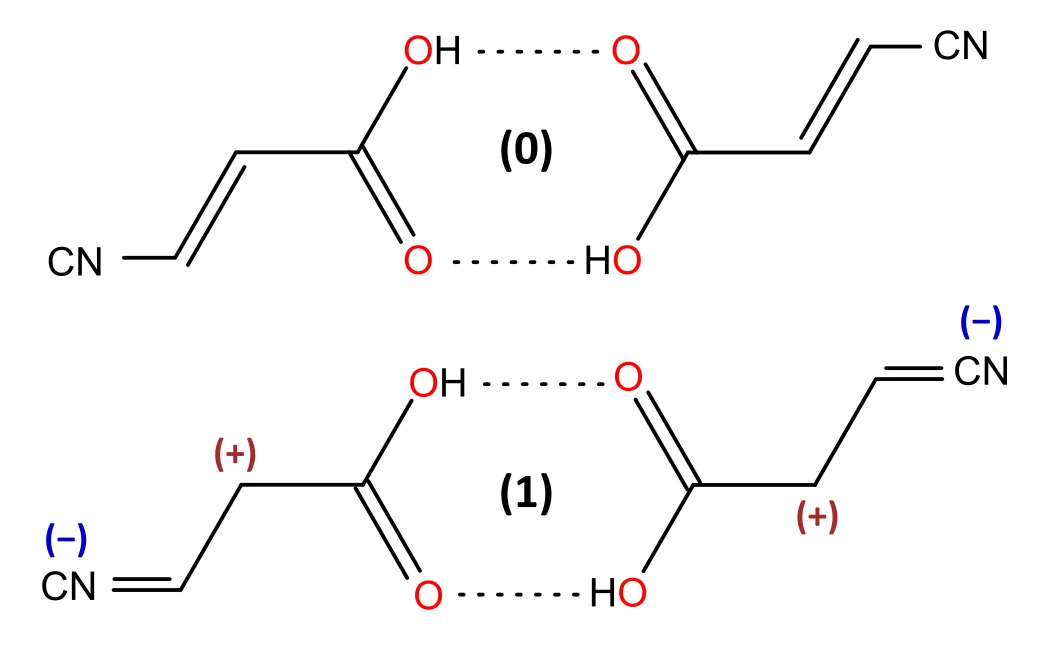
Figure 10. Resonance structures of the nitrile-substituted dimer.
Summary
Table 2. π-populations (ED_G) of the common acrylic-acid core, per monomer, from the NPA tables of the three runs.
| atom (per monomer) | R = H | R = CN | R = NH2 | CN − H | NH2 − H |
|---|---|---|---|---|---|
| C6 (β-carbon, bears R) | 0.922 | 0.943 | 0.951 | +0.021 | +0.030 |
| C1 (α-carbon) | 1.009 | 0.977 | 1.156 | −0.032 | +0.147 |
| C2 (carboxyl carbon) | 0.808 | 0.813 | 0.827 | +0.005 | +0.019 |
| O3 (carbonyl O, H-bond acceptor) | 1.502 | 1.498 | 1.541 | −0.004 | +0.038 |
| O4 (hydroxyl O, H-bond donor) | 1.760 | 1.752 | 1.780 | −0.008 | +0.020 |
| acrylic-acid core | 6.000 | 5.982 | 6.254 | −0.018 | +0.254 |
- NH2 pushes 0.254 e into the acrylic core, and almost 60 % of it lands on a single atom: C1 rises from 1.009 to 1.156 e — the enamine resonance N+=C6–C1− seen directly in the populations. The next largest share, 0.038 e, goes to the carbonyl oxygen, the hydrogen-bond acceptor.
- CN withdraws almost nothing: −0.018 e from the core, an order of magnitude less than NH2 adds. Nor does it act as a clean acceptor — C1 loses 0.032 e while C6 gains 0.021 e, a local polarization of the C6=C1 bond rather than a drain toward the nitrile.
- The delocalized fraction of the π-density (Total EDDB_G / Total ED_G) says the same: 17.7 % for R = H, 17.2 % for CN and 30.4 % for NH2. The amino group nearly doubles it; the nitrile barely touches it.
What to try next
- Export deddb and dedlb instead of dbdf: which component of the change is delocalized, which localized?
- Rerun with -a instead of -s and compare the selections — in particular, whether the automatic classifier also rejects the in-plane nitrile NOBDs.
- Apply differential maps to other perturbations, such as solvation or a conformational change. The recipe is the same: ΔBDFπ = BDFπ(perturbed) − BDFπ(reference).
Tutorial prepared by Paweł Wieczorkiewicz.